What Happens When the Camera Shutter Closes?

The place where I feel most absorbed by my work is the control room of the Vera C. Rubin Observatory, 2,700 meters up on the summit of Cerro Pachón in northern Chile, inside the cozy control room of the Vera C. Rubin Observatory. Just outside, the Milky Way shines bright enough to cast a shadow, but you can only barely see the sheer cliff only a few steps outside the door.
There is a microphone hooked up to the camera on the telescope and the audio plays over a speaker in the control room. The digital age has done away with eyepieces and film plates to observe the night sky. Instead, the “smart” observatories of today use the largest digital cameras in the world to collect more data, faster than ever before, almost automatically. You can hear the shutter open and close thirty seconds later. Every time the shutter closes, the camera records another 25 gigabytes of data. This is the earliest stage of one of the most ambitious experiments in modern cosmology.
Over the next decade, the observatory will conduct the Legacy Survey of Space and Time (LSST), photographing the entire southern sky visible from Chile and returning to each patch of sky every few nights for the next ten years. The LSST Camera is the largest digital camera ever built for astronomy. It has 3.2 billion pixels and images an area equal to about 45 full moons.
The survey will study dark energy and dark matter, which together make up about 95 percent of the Universe's energy content but have never been directly detected. It will also inventory the solar system, track changes in the night sky and map the Milky Way.
The achievability of these goals depends on the quality of the images being taken. It is from these images that we measure the size, shape, position, and brightness of objects that we use to understand the fundamental physics of the Universe. Each image passes through a sequence of processing steps and verification analyses, called the “data production pipeline” to ensure that the images are useful and trustworthy to make scientific discoveries downstream. Once an image is taken, this is what happens to it.
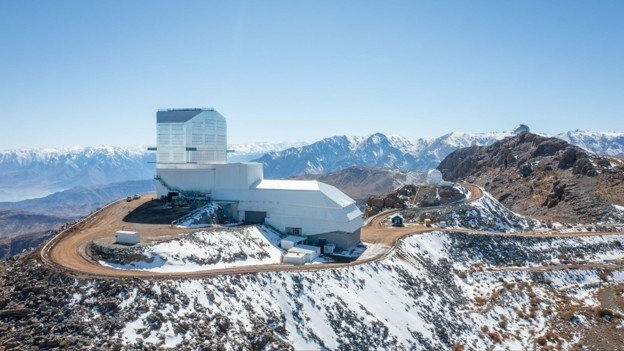
Seven seconds after an image is taken
The images are not processed on the mountain. Each one travels over a 600-gigabit-per-second fiber link to the U.S. Data Facility at SLAC National Accelerator Laboratory in Menlo Park, California. It arrives in about seven seconds, by which point the camera is already taking the next exposure.
One minute after an image is taken
From here, the process is automated and must keep pace with the camera. A raw image carries artifacts, distortions introduced by the camera and optics rather than features of the sky. Pixels vary slightly in sensitivity, and some defective. Signal leaks between pixels, an effect called crosstalk. Brighter objects appear more bloated. Cosmic rays leave streaks, satellites leave trails and moonlight scatters through the optics. Until these effects are removed, no measurement can be trusted, so the software models the physics behind each one and removes it.
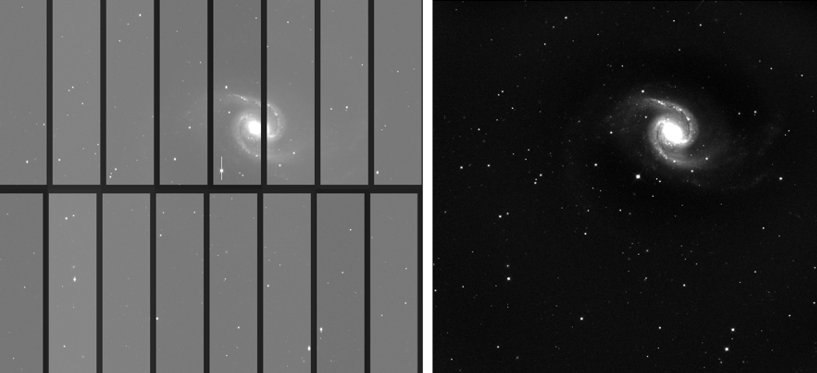
Every object is also blurred. Atmospheric turbulence and small imperfections in the optics spread a star's light into a fuzzy spot about 3.5 pixels wide. The size and shape of the spot is called the point spread function, and it varies across the image and from one exposure to the next. Because stars are effectively point sources, the pipeline uses them to measure the amount of distortion everywhere in the frame.
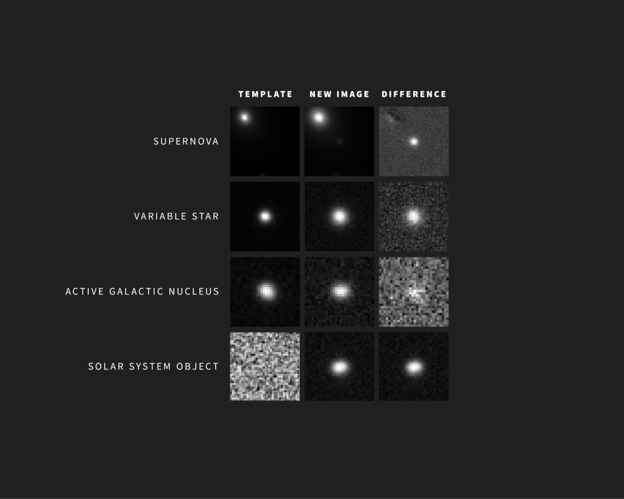
Next, the pipeline subtracts a template, a reference image of the same patch of sky built from earlier observations, leaving only what has changed. That might be a supernova, an asteroid, a variable star or something never seen before. Within about a minute of the shutter closing, these detections go out worldwide as alerts, up to 10 million a night, to “data brokers” that filter and classify them.
Six months after an image is taken
If you want to measure the most distant and faintest objects, it might be more useful to use the hundreds of other images of the same sky that accumulate over time, so every few months to a year, we reprocess the full archive from scratch and combine all the data together.
The first task is to make the images consistent. Atmospheric conditions vary, and the telescope's sensitivity drifts as dust collects on its mirrors. The software fits a theoretical model of the atmosphere and the instrument to hundreds of thousands of repeatedly observed stars, separating what changes from night to night from what does not. Afterward, a star measured in April and again in December returns the same brightness to within a few parts in a thousand.
The images are then aligned and averaged together to form a combined image, the equivalent of a single exposure lasting many hours. Averaging reduces noise and reveals objects far fainter than can be detected in a single, thirty second image, increasing what astronomers call depth.
In images that deep, many objects overlap, and a process called deblending uses their colors in the telescope's six filters to determine which light belongs to which object.
One year after an image is taken
The final stage, validation, tests the pipeline against more than 3,000 numerical requirements set by the scientific community, covering image quality, the consistency of repeated measurements, and the overall error budget.
To check them, we compare Rubin's measurements with external data, including those from the European Space Agency's Gaia mission, which has measured more than a billion stars. We also inject artificial stars and galaxies of known brightness and shape into real images, run the full pipeline and make sure that we measure exactly what we put in. Those injected sources, along with labels of real data determined by human volunteers, help train the machine-learning tool that gives every alert a reliability score.
The next decade
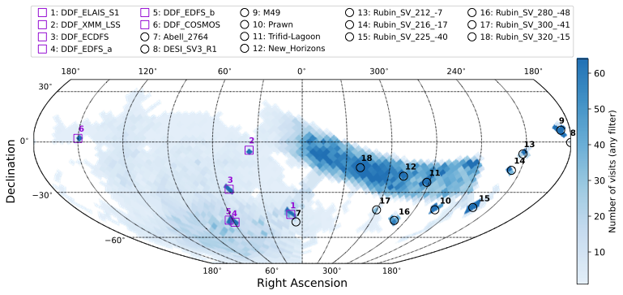
Only 60 TB of data have been released to the scientific community as part of a Data Preview 2, a rehearsal for the full survey. Processing all of the data from commissioning, the testing period before the survey formally began, took three million CPU hours over six months. The first full-year release, expected in early 2028, will be roughly 20 times larger.
The central problem is not storage. The computing required to process the data grows faster than the accumulation of data itself, which is already too large for anyone to download or examine in full.
As a result, some of the most important work on Rubin now happens far from the mountain. Researchers at the Center for Decoding the Universe, or C4DU, founded in 2024 by Stanford Data Science and the Kavli Institute for Particle Astrophysics and Cosmology, develop machine learning and artificial intelligence methods to produce, analyze and interpret LSST data. At the scale of petabytes, data production requires new approaches, and those approaches have to be grounded in physics.
The people who build the data pipelines are also among the scientists who will use the data they produce. There is therefore a personal obligation to make sure that the data is timely, trustworthy, and accessible.
Edited by Lori Ann White, Toby Satterthwaite, and Kenzie Lauritzen
Related Research Areas

NSF-DOE Vera C. Rubin Observatory's Legacy Survey of Space and Time
The Legacy Survey of Space and Time (LSST) is a 10-year survey of the southern sky that is taking place at the NSF-DOE Vera C. Rubin Observatory, located on the El Peñon peak of Cerro Pachón in northern Chile.
Artificial Intelligence and Machine Learning
At KIPAC, researchers are working to advance the frontiers of astronomy through the application of AI and machine learning, and simultaneously pushing the frontiers of AI/ML methods in pursuit of astrophysics discovery.
Scientific Data Visualization
KIPAC's visualization and data analysis facilities provide hardware and software solutions that help users at KIPAC and SLAC to analyze their large-scale scientific data sets.Related People